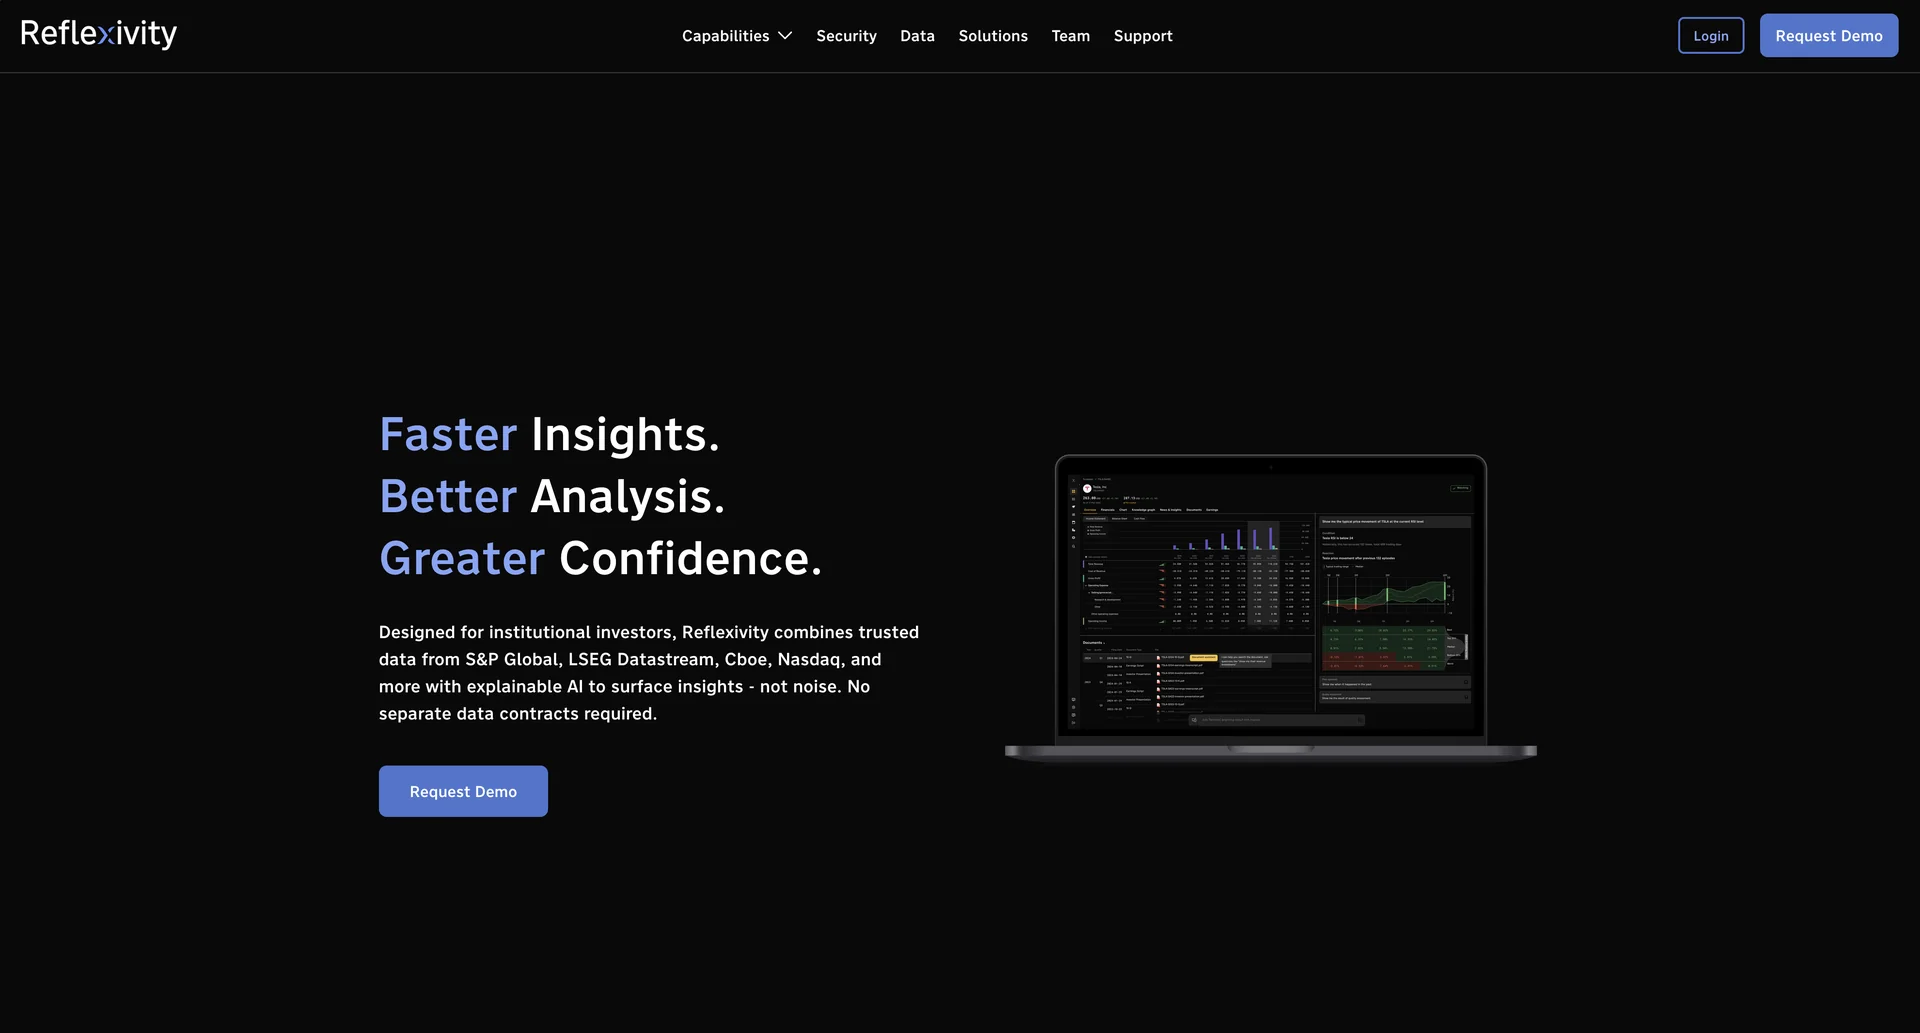
Description
🖼 Tool Name:
Reflexivity
🔖 Categories:
Analytics & Dashboards
Data Preperation & Cleaning
Testing & Quality Assurance
DevOps, CI/CD & Monitoring
✏ What does this tool offer?
AI-Native Observability: Reflexivity is a high-performance observability platform specifically designed to monitor and debug AI agents and Large Language Model (LLM) applications in production.
Trace & Debug: It allows developers to trace complex, multi-step agentic workflows, providing a visual breakdown of every step, prompt, and tool call made by the AI.
Evaluation Frameworks: Offers built-in tools for running automated evaluations (Evals) on AI outputs to measure accuracy, safety, and latency.
Dataset Management: Automatically captures production data to create high-quality datasets for fine-tuning or regression testing.
Real-time Analytics: Provides dashboards that track token usage, cost, and model performance metrics across different providers (OpenAI, Anthropic, etc.).
⭐ What does it actually offer based on user experience?
Granular Visibility: Users value the ability to see "inside the black box" of AI agents, making it much easier to identify why an agent might be looping or hallucinating.
Optimized for Scale: It is praised for its ability to handle high-volume event streams without introducing significant latency to the application.
Developer-Centric Design: The platform is built for engineering teams, with a focus on clean APIs and a UI that mirrors a debugger rather than just a marketing dashboard.
Prompt Iteration: Designers and engineers use it to version-control prompts and compare how different versions perform on the same real-world data.
Cost Management: Provides clear visibility into "hidden costs" associated with long-context windows or frequent tool calls.
🤖 Does it include automation?
Yes, Reflexivity leverages automation to manage the complexity of AI systems:
Automated Evaluation (Auto-Evals): Uses LLM-as-a-judge to automatically score production traces against specific criteria (e.g., tone, factuality).
Automated Anomaly Detection: Flags unusual spikes in latency or token consumption that could indicate an agent is stuck in an infinite loop.
Smart Trace Grouping: Groups similar agent failures or "pathways" together to help developers prioritize fixes for common failure modes.
Dataset Augmentation: Automatically suggests production traces that should be added to golden test sets based on their uniqueness or failure status.
💰 Pricing Model
Item Details: Usage-based billing (per trace or per million tokens monitored).
General Concept: Pricing typically scales with the number of production requests. Annual commitments often come with higher throughput limits and technical support.
🆓 Free Plan Details
Feature: Free Tier / Community Plan.
Cost: Free ($0/mo). Includes a limited number of traces per month (e.g., 5,000) and basic data retention.
💳 Paid Plans (2026 Estimates)
🔹 Pro Plan
Item: Price / Details: Approx. $50 - $150/month.
Item: Features / Details: Increased trace limits, 30-day data retention, advanced evaluation metrics, and team collaboration tools.
🔹 Growth / Scale Plan
Item: Price / Details: Approx. $300 - $800/month.
Item: Features / Details: Massive trace volume, longer retention (90 days+), custom evaluation templates, and priority API access.
🔹 Enterprise Plan
Item: Price / Details: Custom Pricing.
Item: Inclusions / Details: On-premise deployment options (VPC), SSO, dedicated support, and unlimited data retention.
🧭 How to access the tool:
Cloud-based platform with SDKs for Python and TypeScript. Accessible via the web dashboard.
