Features
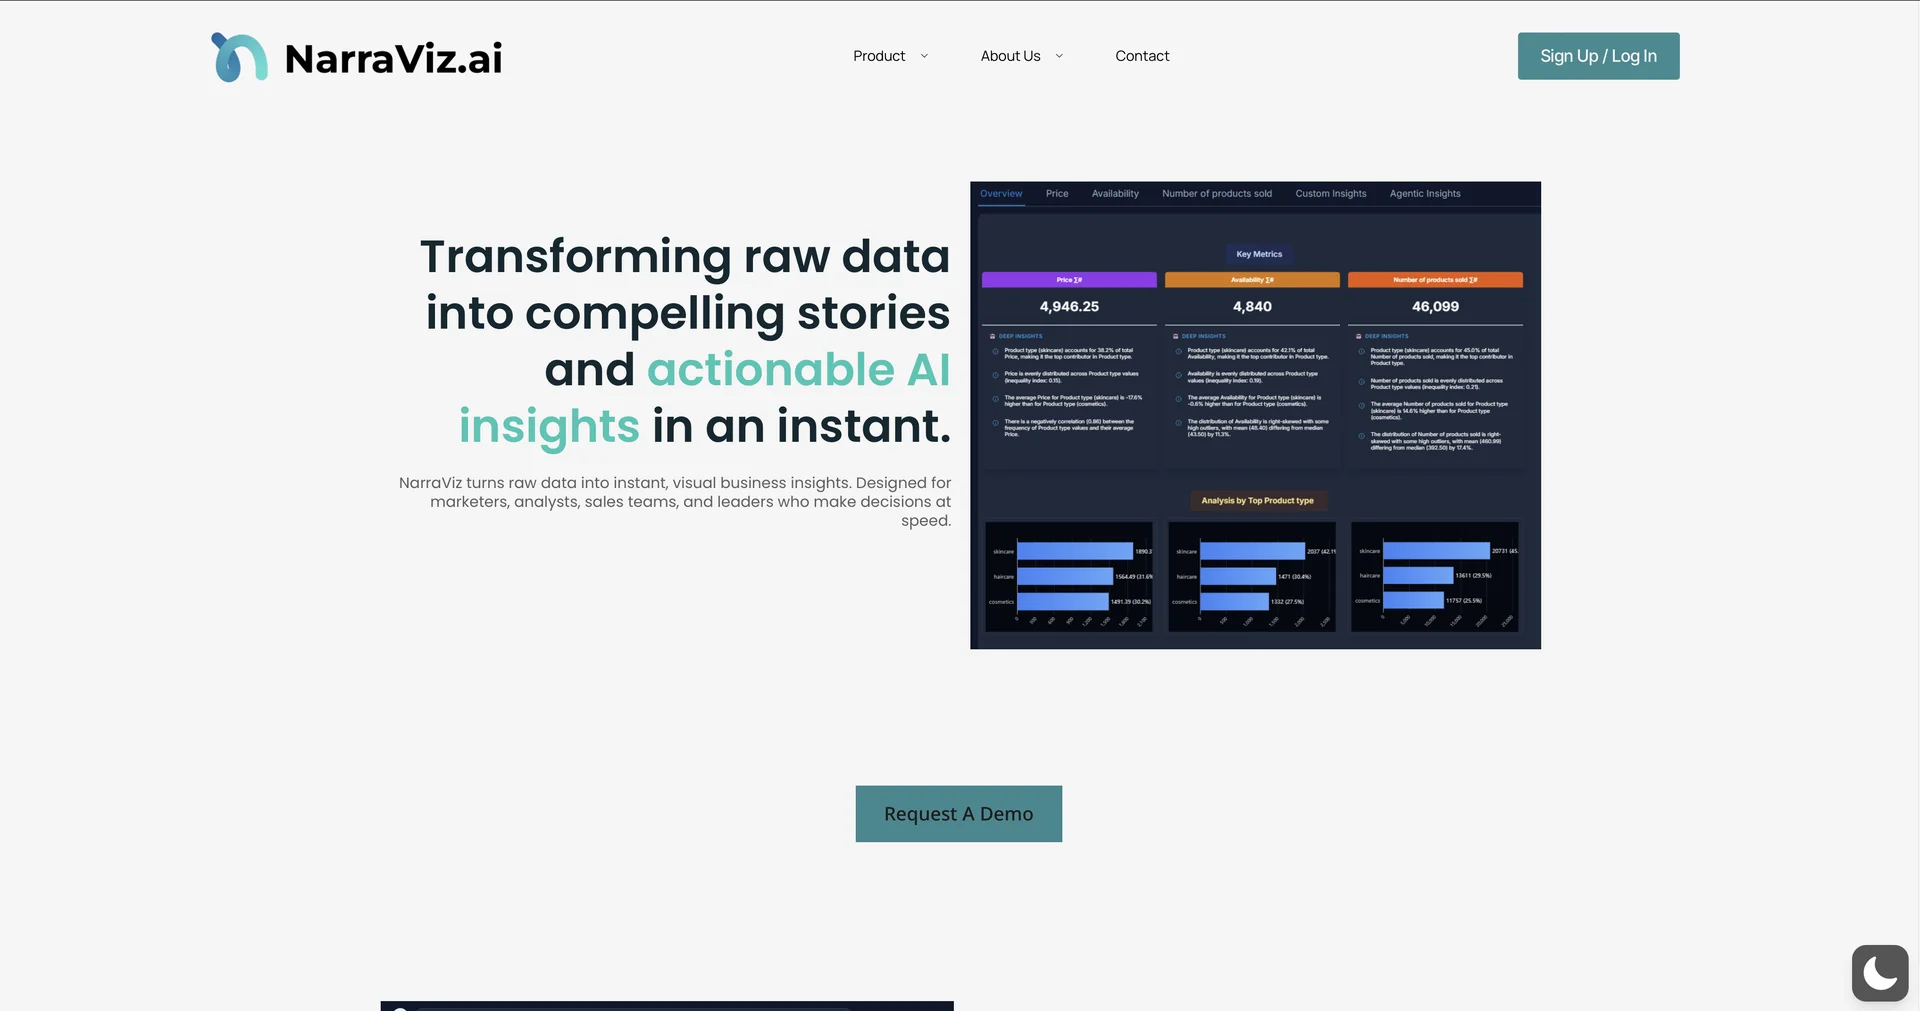
- Recommends the best chart type, such as heatmaps, Sankey or radar, for your question
- Generates a data story explaining trends and projected impact
- Cleans and formats messy CSV or SQL exports automatically
- Answers multi-layered questions with visualized results
- Builds interactive knowledge graphs to visualize hidden data connections
- Compares performance against industry or historical benchmarks
- Builds dashboards and narrative summaries from uploaded Excel or CSV files
Pricing Details
💵 Pricing & Plans (February 2026 Status): Plan Price (Approx.) Key Features Explorer (Trial) $0 Basic data visualization; limited dataset size; core chart types. Pro Analyst No Public Pricing Full visualization engine; automated data prep; advanced storytelling; priority support. Enterprise / R&D Custom Knowledge graph integration; custom data connectors; SOC2 compliance; dedicated analyst. 🎁 How to Get Started: Visit narraviz.ai. You can immediately start by uploading a sample dataset (like an Excel or CSV file). Use the Natural Language Query box to ask a question about your data, and watch as the AI builds a custom dashboard and narrative summary for you.