Features
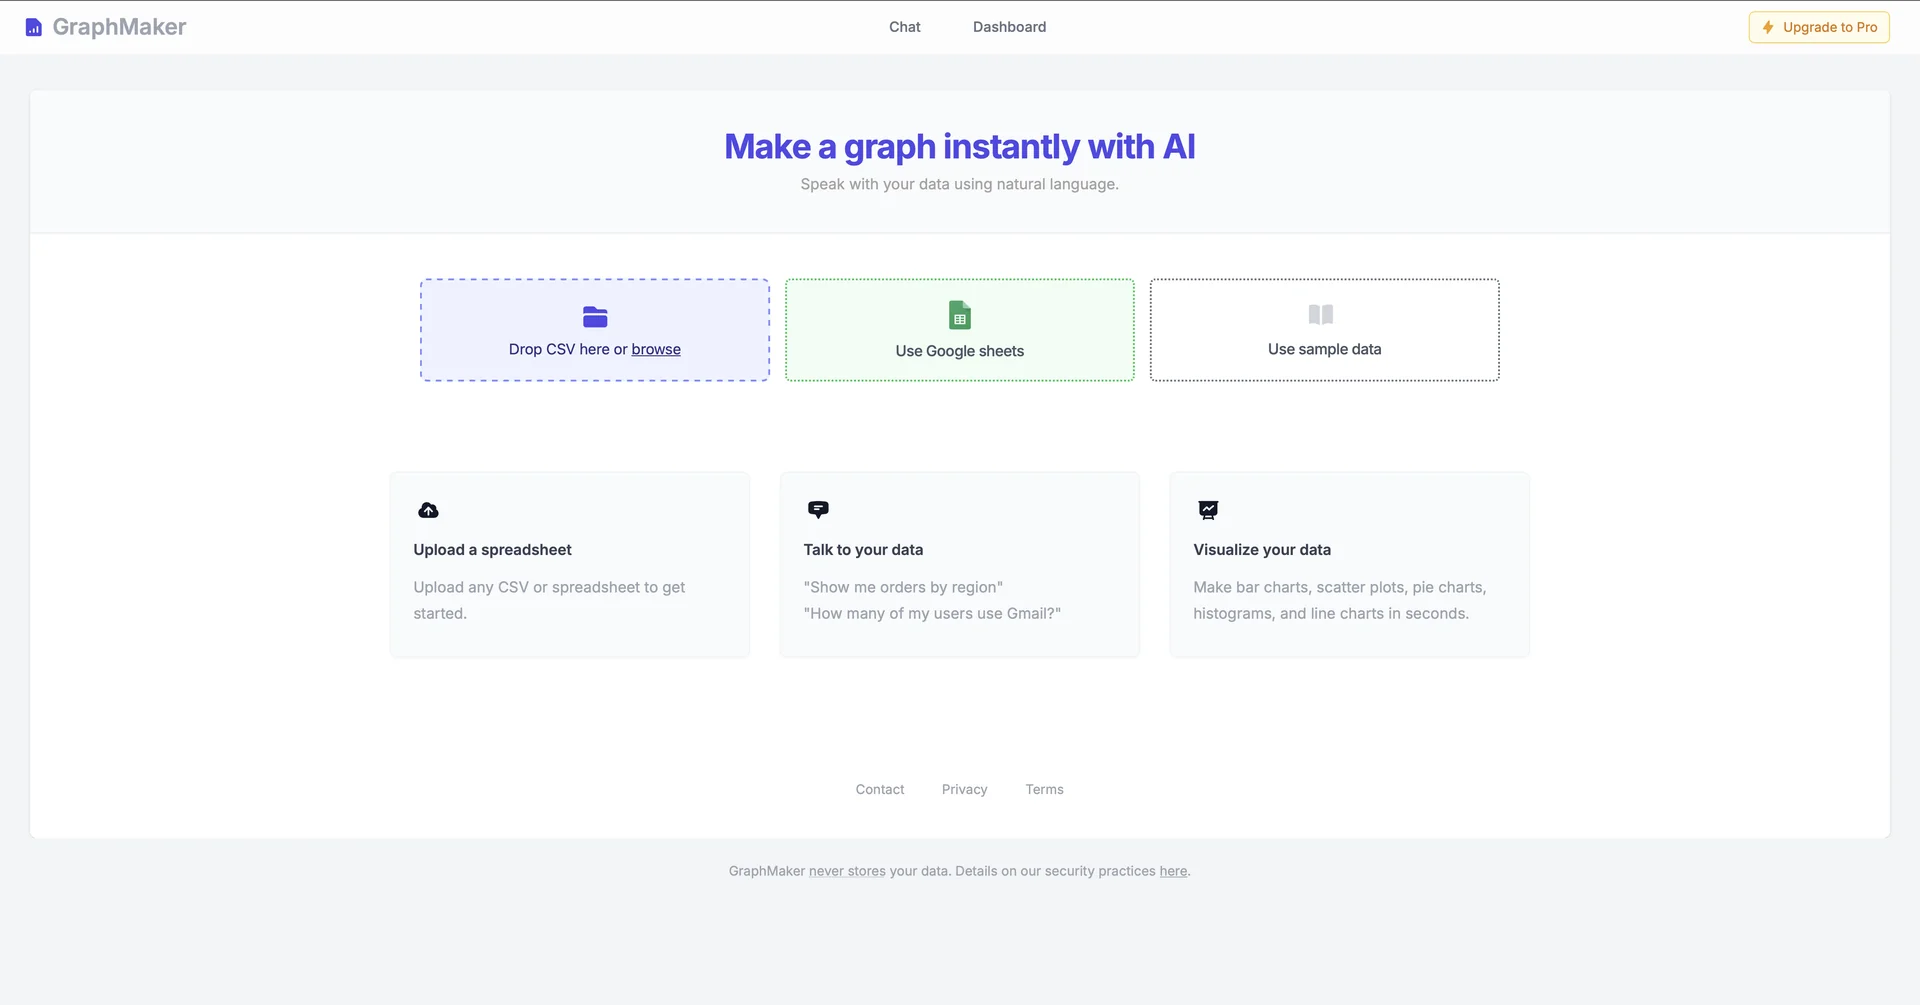
- Turns plain-English prompts into charts and data visualizations
- Imports data from CSV, Excel, Google Sheets, sample datasets or raw text
- Creates bar, scatter, pie, line charts and histograms
- Translates queries into Python scripts to transform data
- Automatically selects axes, legends and color scales
- Processes datasets without storing uploaded personal data on servers
- Exports charts for reports and presentations
Pricing Details
💰 Pricing Model Item Details: Free Web Tool Access / Web Application. General Concept: Web app access is publicly available to upload datasets and generate graphs directly in the browser. 🆓 Free Access Details Feature: Free Access Tier. Details: Users can visit the web application to drop CSV files, connect spreadsheets, and generate charts at no cost. Cost: Free ($0) Base Web Access. 💳 Access & Subscription Options (Official Standards) Access Tier Price Structure Primary Workspace Scope & Allowances 🌱 Free Web Tier $0 / Free CSV/Spreadsheet uploads, natural language chart generation, basic graph exports. ⚡ Enterprise / Extended Access Custom / Extended Expanded dataset sizes, API integrations, and advanced backend processing capabilities.