Description
️ Tool Name: 🖼
Tableau Public
Categories: 🔖
Analytics and Dashboards
Data and Analytics
Education and Research
Finance, Forecasting, and Dashboards
Integrations and APIs
️ What does this tool offer? ✏
Tableau Public is a free platform for exploring and visualizing data, creating and sharing visualizations. It allows users to discover the creativity of the DataFam community, find inspiration, develop their data skills, and share their work with the world. The platform offers more than 13 million public data visualizationsand allows users to create and share work that helps them attract the attention of professionals in the data and analytics field, join a global community of more than 6 million data professionals, and build their careers.
Tableau Public allows users to engage with public visualizations from around the world and provides educational content that helps them understand the platform and develop their data visualization skills with the help of the DataFam community. Users can follow Tableau Public authors to discover new topics, visualization ideas, and community activities, and learn from the work of others.
The platform features a diverse group of authors and data visualization professionals, including Damola Ladipo, a data visualization specialist at USAID Data Services at DevTech Systems, Inc., who develops dashboards, maps, charts, and standalone visualizations. He joined the Tableau Public community in 2020 and became a Featured Author in 2021. He uses Tableau Public to find inspiration for his visualizations and connect with the #DataFam community. You can reach him on X and LinkedIn.
The group also includes Chiaki Ishida,who has been using Tableau since 2018 and discovered her passion for data visualization. She actively participates in #MakeoverMonday, #WorkoutWednesday, #VizforSocialGood, and JTUG (Japan Tableau User Group). She focuses on creating simple, easy-to-understand visualizations, though she occasionally contributes complex, challenging, and playful ones as well. She strives to encourage more people in Japan to join the community and can be reached via X.
The group also includes Kasia Gasiewska-Holc,a senior marketing analyst at the London Stock Exchange Group (LSEG), who discovered Tableau three years ago and became passionate about the power of data visualization. She uses Tableau Public to connect with people who share her interests and turn creative ideas into data stories. She follows members of the #DataFam community, learns from them, and uses their work as a source of inspiration for her own projects. She is particularly interested in sustainability and environmental issues, She also creates visualizations on topics such as music and TV series, and in every project, she strives to push the boundaries of what can be achieved with Tableau by applying custom and unique animations. You can connect with her on X and LinkedIn.
Another author is Kevin Wee( 黃克文), a Ph.D. student at Purdue University who is researching the impact of animation design on student learning experiences. He uses Tableau Public to showcase his ability to visualize data in an appropriate and creative way and to share the visualizations he has created for his research with collaborators, stakeholders, and other researchers. He appreciates the app’s and web version’s user-friendly interface and the wealth of available resources. He started using Tableau Public last October, participated in #MakeoverMonday, and was selected as “Favorite of the Week” ten times. His favorite topics include higher education and student learning, and he can be reached via X, LinkedIn, and his website.
The platform also features Brittany Rosenau, a senior analyst at JLL who believes in the importance of equitable access to data and is passionate about what data visualization can achieve in communities and companies. She was introduced to Tableau Public through an internal training program and has continued to use it; tapping into the published content repository and participating in community data challenges are among her top interests in the field of data. She can be reached via X and LinkedIn.
Another author is Priyanka Dobhal,a Technology Lead at USEReady, who discovered Tableau in 2018 and loved the art of visualization from the start. She sees Tableau Public as a blank canvas and considers the ability to engage with and learn from the #DataFam community to be one of the platform’s greatest strengths. She often focuses on creating visualizations about movies, music, and sports, She also enjoys creating her own datasets for her visualizations and actively participates in #MakeoverMonday, #WorkoutWednesday, and #IronQuest. She credits the community for part of her learning and growth, and can be reached via X and LinkedIn.
The platform also features a testimonial from Priya Padham,a Tableau Visionary and Public Author, in which she explains that the dashboards she finds on Tableau Public inspire her and help her see the possibilities available and apply new techniques in her work.
Tableau Public also focuses on career development through the “Hire Me” button, which helps users get noticed by hiring managers and professional networks. The platform features stories from authors who, by building a compelling profile on Tableau Public, have gained attention, advanced their careers, and secured new job opportunities. Among them is Zainab Ayodimeji, whom Tableau Public helped land her dream job at Spotify,Elisa Davis, whose Tableau Public profile changed the course of her career, andIdris Akilapa, for whom the “Hire Me” button led to a job offer without having to apply for positions.
Kevin Flerlage,a Tableau Visionary Hall of Fame inductee and Public author, a testimonial explaining that Tableau Public provides a visual portfolio of users’ work, that he landed his dream job after using Tableau Public for less than six months, and that the platform has changed his life and the lives of hundreds of others.
Tableau Public allows users to create and share visualizations and find daily inspiration through “Viz of the Day,”with the possibility of having their work featured in the selections. One example is “SJ Advisory Services” by Luis Claudio Rodríguez Ortiz, which provides a centralized view of inpatient volumes while highlighting key operational performance indicators alongside cost and profitability details by provider, service line, and payer.
The platform also allows users to connect with the DataFam community by following @TableauPublic on X and tagging it when sharing visualizations; users can create an account and take advantage of Tableau Public.
What does it actually offer based on user experience? ⭐
Explore millions of public visualizations and use them as a source of inspiration.
Create visualizations and dashboards, and share your work with the community.
Interact with data visualizations created by users from around the world.
Learn from Tableau Public authors’ work and techniques.
Participate in data community challenges and initiatives such as #MakeoverMonday, #WorkoutWednesday, #VizforSocialGood, and #IronQuest.
Build a visual portfolio of your data visualization work.
Use the “Hire Me” button to help get noticed by recruiters and professional networks.
Leverage the repository of published content and the DataFam community to develop your skills.
Have your work featured in Viz of the Day.
Use the platform to find inspiration on a variety of topics, such as sustainability, the environment, education, music, movies, and sports.
Use Tableau Public as a space to experiment, learn, and develop data visualization techniques.
Share research and visualizations with collaborators, stakeholders, and researchers.
Take advantage of the educational content and resources available to develop data visualization skills.
Does it include automation? 🤖
The Tableau platform includes analytical capabilities powered by artificial intelligence and automation; however, Tableau Public itself focuses primarily on data exploration, visualization, and sharing public visualizations. Agentic Analytics capabilities are primarily found in Tableau’s commercial products, such as Tableau Cloud, Tableau Server, and Tableau Next.
Tableau Cloud provides fully hosted agentic analytics, with AI-powered insights through Tableau Agent and Tableau Pulse. Tableau Server offers self-managed agent-based analytics, while Tableau Next represents the agent-based analytics layer built on the Agentforce 360 Platform and integrated with Tableau Semantics and Agentforce.
Pricing Model: 💰
| For the item | Details |
|---|---|
| Free Product | Tableau Public |
| Commercial Subscription Type | Paid subscription with an annual contract |
| Billing | Annual only |
| Monthly Plans | Not available ❌ |
| Tableau Cloud | Capacity-based Pricing Options |
| Tableau Server | Compute-based Pricing Options |
| License Types | Creator, Explorer, Viewer |
| Basic Support | Standard Success for all customers |
| Advanced Learning and Support | eLearning and Premier Success depending on the plan |
🆓 Free Plan Details
| Product | Details |
|---|---|
| Tableau Public | A free platform for exploring and visualizing data, as well as creating and sharing visualizations |
| Available Content | More than 13 million public data visualizations |
| Interaction | Interact with public visualizations from around the world |
| Learning | Educational content and resources for developing data visualization skills |
| Follow authors | Ability to follow authors and learn from their work |
| Profile | Create a profile and showcase your work |
| Hire Me | The ability to use the " Hire Me " feature to increase visibility to hiring managers |
| Community | Participate in the DataFam community and community initiatives |
| Community Content | Take advantage of Viz of the Day and community content |
| Tableau Desktop Free Edition | Create and analyze Excel and CSV files and databases for free |
| Data Storage | Store data locally on the user's device |
| Desktop Free Edition Limitations | Does not support connecting to Tableau Cloud or Tableau Server for stored data sources, online publishing and sharing, or sharing composite workbooks with other users |
Tableau Cloud 💳
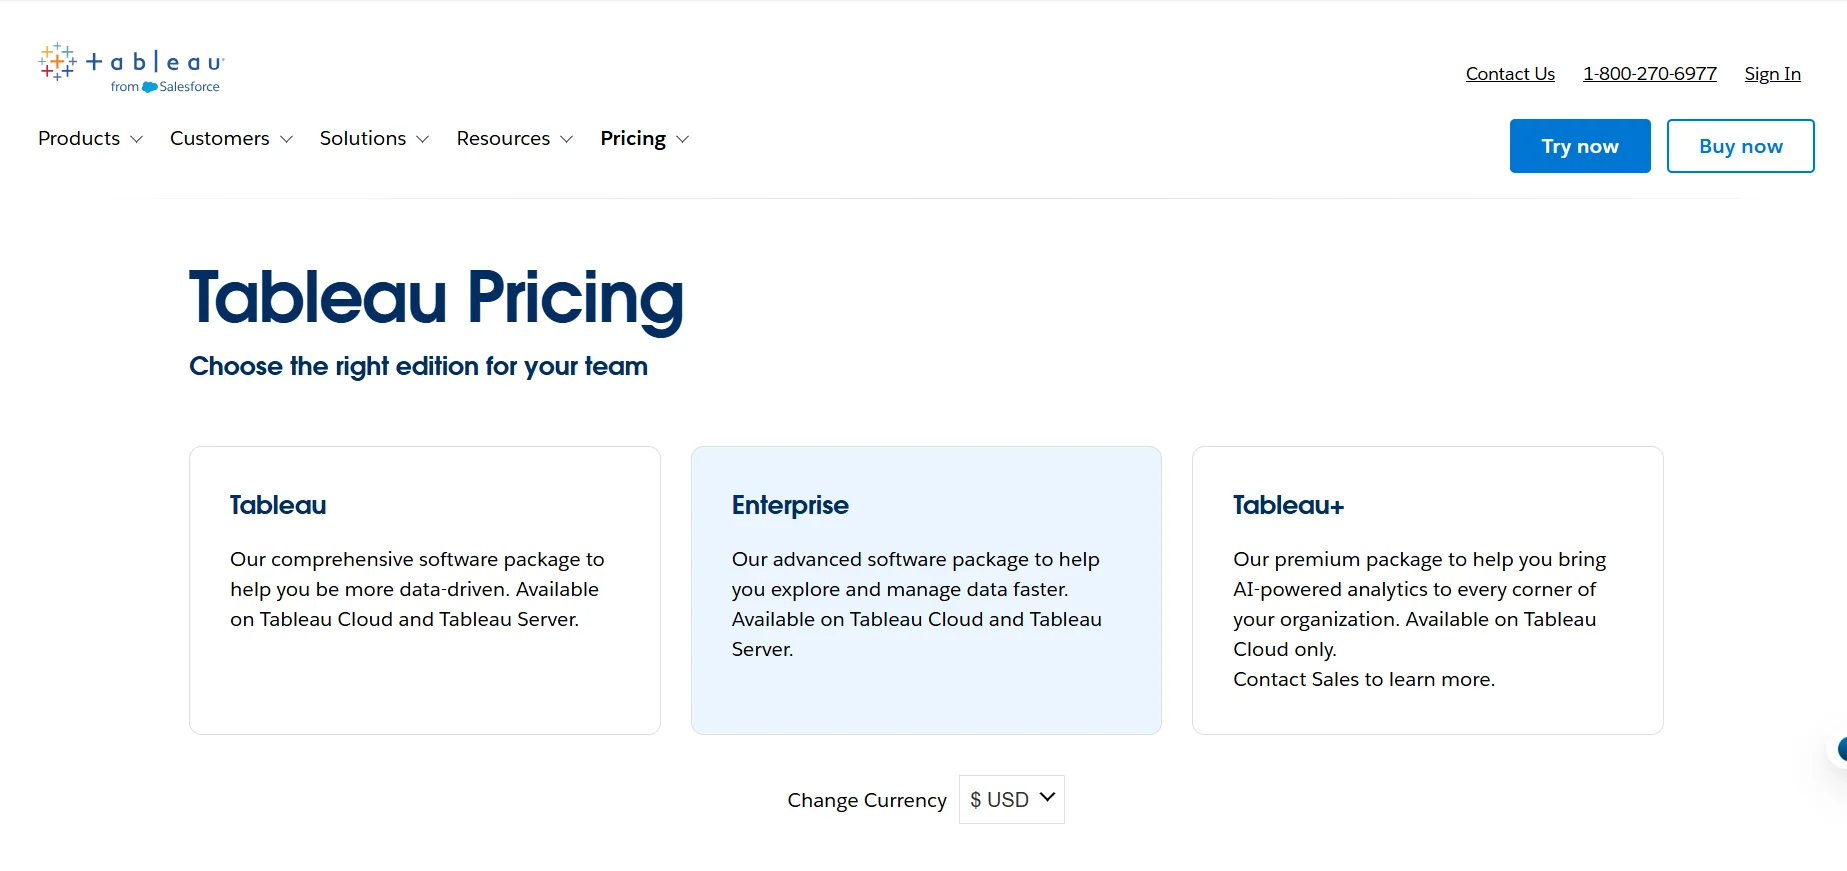
| Plan | Price when billed annually | Key Features |
|---|---|---|
| Tableau Cloud – Standard | Starting at $15/user/month | Web-based authoring, management, and collaboration; Tableau Desktop; Prep Builder; Tableau Pulse |
| Tableau Cloud – Enterprise | Starting at $35/user/month | All Standard features + Advanced Management + Data Management + 10 sites + eLearning |
| Tableau Cloud+ | Contact Sales | All Enterprise features + Tableau Agent in Tableau Cloud and Pulse + Premier Success + 50 seats + Release Preview |
| Tableau+ Bundle | Contact Sales | Combines Tableau Cloud and Tableau Next, and includes Cloud+ benefits plus Tableau Next |
️ Tableau Server 🖥
| Plan | Price with annual billing | Key Features |
|---|---|---|
| Tableau Server – Standard | Starting at $15/user/month | Web-based authoring, management, and collaboration; Tableau Desktop; Prep Builder; Tableau Agent for authoring and Prep |
| Tableau Server – Enterprise | Starting at $35/user/month | All Standard features + Advanced Management + Data Management |
| Tableau Server+ | Contact Sales | Enterprise features + additional non-production environments + Premier Success |
Tableau Next 🚀
| Plan | Price with annual billing | Key Benefits |
|---|---|---|
| Tableau Next | Starting at $40/user/month | Tableau Agent, Tableau Semantics, and native integration with Slack |
| Tableau Next + Tableau+ Bundle | Contact Sales | Tableau Next + Tableau Cloud+ Edition |
Capacity- and compute-based pricing options 📊
| Option | Product | Details |
|---|---|---|
| Capacity-Based Pricing | Tableau Cloud | Purchase Viewer Blocks based on deployment size, providing broad access to viewers without the need for individual Viewer licenses for each user and without additional overage fees |
| Compute-based Pricing | Tableau Server | Infrastructure billing based on 8-core processing units instead of per-user licensing, with the option to specify the number of Creator licenses required |
Types of User Licenses 👤
| License Type | Usage |
|---|---|
| Creator | Create workbooks and data flows, prepare data, explore and visualize |
| Explorer | Explore and modify existing works |
| Viewer | View and interact with dashboards, and receive alerts and insights |
Support and Learning 🎓
| Plan/Tier | Support and Educational Benefits |
|---|---|
| All Tableau customers | Standard Success, self-paced learning resources, and on-demand learning |
| Enterprise | eLearning |
| Cloud+ | Premier Success + eLearning |
| Server+ | Premier Success + eLearning |
| Tableau+ Bundle | Premier Success + eLearning |
| Premier Success | Expert guidance, guided training, and fast, round-the-clock support |
How to access the tool: 🧭
Tableau Public: A web platform for exploring, creating, and sharing public visualizations.
Tableau Desktop Free Edition: Free desktop software for analyzing Excel and CSV files, databases, and storing data locally.
Tableau Cloud: A fully hosted analytics platform managed by Tableau.
Tableau Server: A self-managed enterprise analytics solution that can be deployed on-premises, in a private cloud, or on a public cloud instance.
Tableau Next: An analytics layer built on the Agentforce 360 Platform, available for purchase separately or as part of the Tableau+ Bundle.
Creator, Explorer, and Viewer licenses are available to users based on the product and deployment.
Capacity-based pricing options are available for Tableau Cloud, and compute-based options are available for Tableau Server.
Tableau offers sections for learning, support, and community, including Tableau Community, Tableau Public, Tableau User Groups, Community Leaders, DataDev, Community Projects, Tableau Neighborhood, Academic Programs, and Events.
It offers sections for Support, Knowledge Base, Learning and Certification, Tableau Help, and All Releases.
Tableau offers the “Need help? Ask Agentforce”support service, where Agentforce can answer questions or connect the user with a sales representative.
Trial link or official website: 🔗