Zola Analytics
Description
🖼️ Tool Name:
Zola Analytics
🔖 Tool Category:
AI-powered financial analytics and data visualization platform; falls under Data & Analytics, Finance / Investment Research tools.
✏️ What does this tool offer?
Converts natural-language questions into charts and reports very quickly.
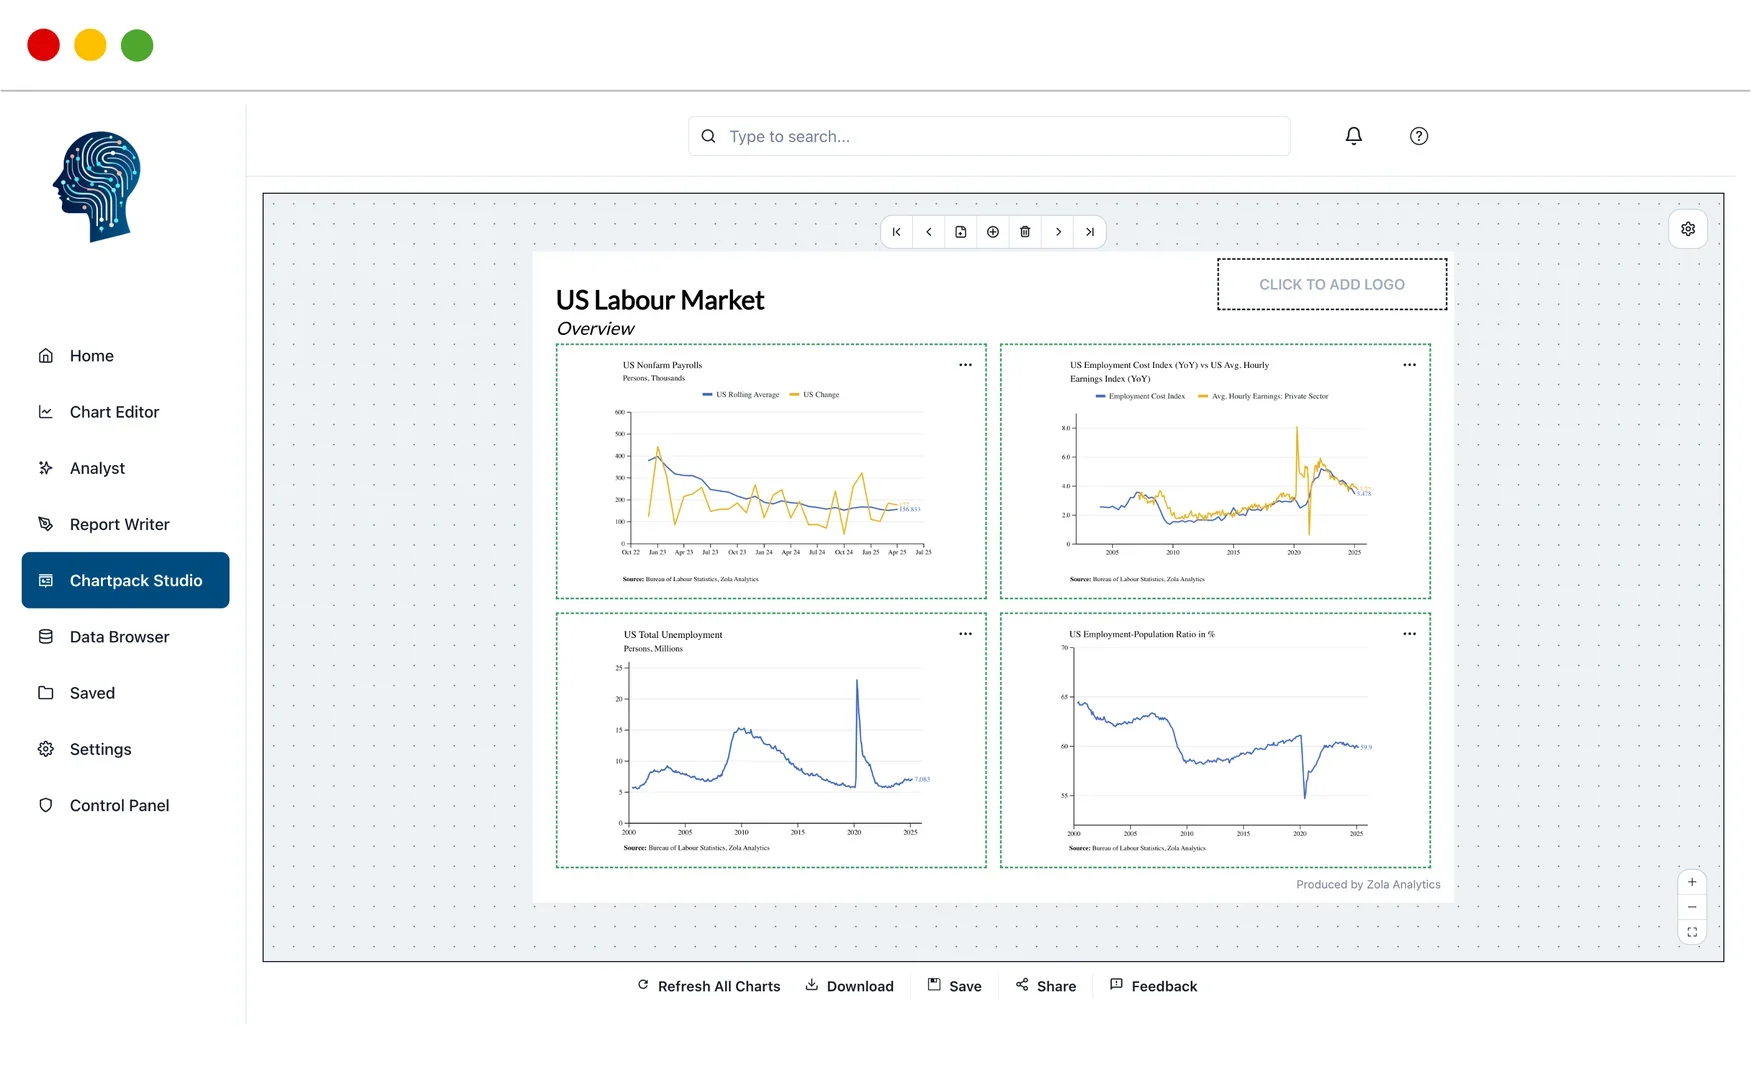
Lets users build publication-ready visualizations without manual work in Excel or PowerPoint.
Provides access to over 100 unified data sources (macroeconomic, financial markets, etc.) in one interface.
Has AI agents that can run multi-step workflows (gathering & cleaning data, generating insights) so analysts can offload repetitive work.
Live dashboards and collaborative reports / chartpacks that auto-update when underlying data changes.
⭐ What does the tool actually deliver based on user experience?
• Instantly generate charts like “market sector performance over time” or “macro-trends since the last recession” just by typing a question.
• Reduce time spent wrangling data, formatting, copying between Excel / PPT, etc.
• Shared workspaces so teams can collaborate, share reports that stay up-to-date.
• Presentable outputs: visuals, charts, reports that look professional without needing manual touch-ups.
🤖 Does it include automation?
Yes — many automated features:
Natural-language input → automatic chart/report generation.
AI agents to handle multi-step workflows (data retrieval, cleaning, analysis).
Live dashboards / chartpacks that update automatically when data sources change.
💰 Pricing Model:
Subscription / SaaS model. There is a tiered pricing structure.
🆓 Free Plan Details:
There is a free trial available so users can test the service.
💳 Paid Plan Details:
One plan (“Zola Essential”) costs £89.99/month (billed monthly) for core features.
Higher tier plans offer more seats, more usage, AI analyst agents, shared workspaces, priority support.
🧭 Access Method:
• Use via web app (browser).
• Desktop support (Mac/Windows) via WebCatalog for distraction-free usage.
🔗 Experience Link: