Gorilla Terminal
Description
🖼️ Tool Name:
Gorilla Terminal
🔖 Tool Category:
AI-powered investment research & financial analytics platform
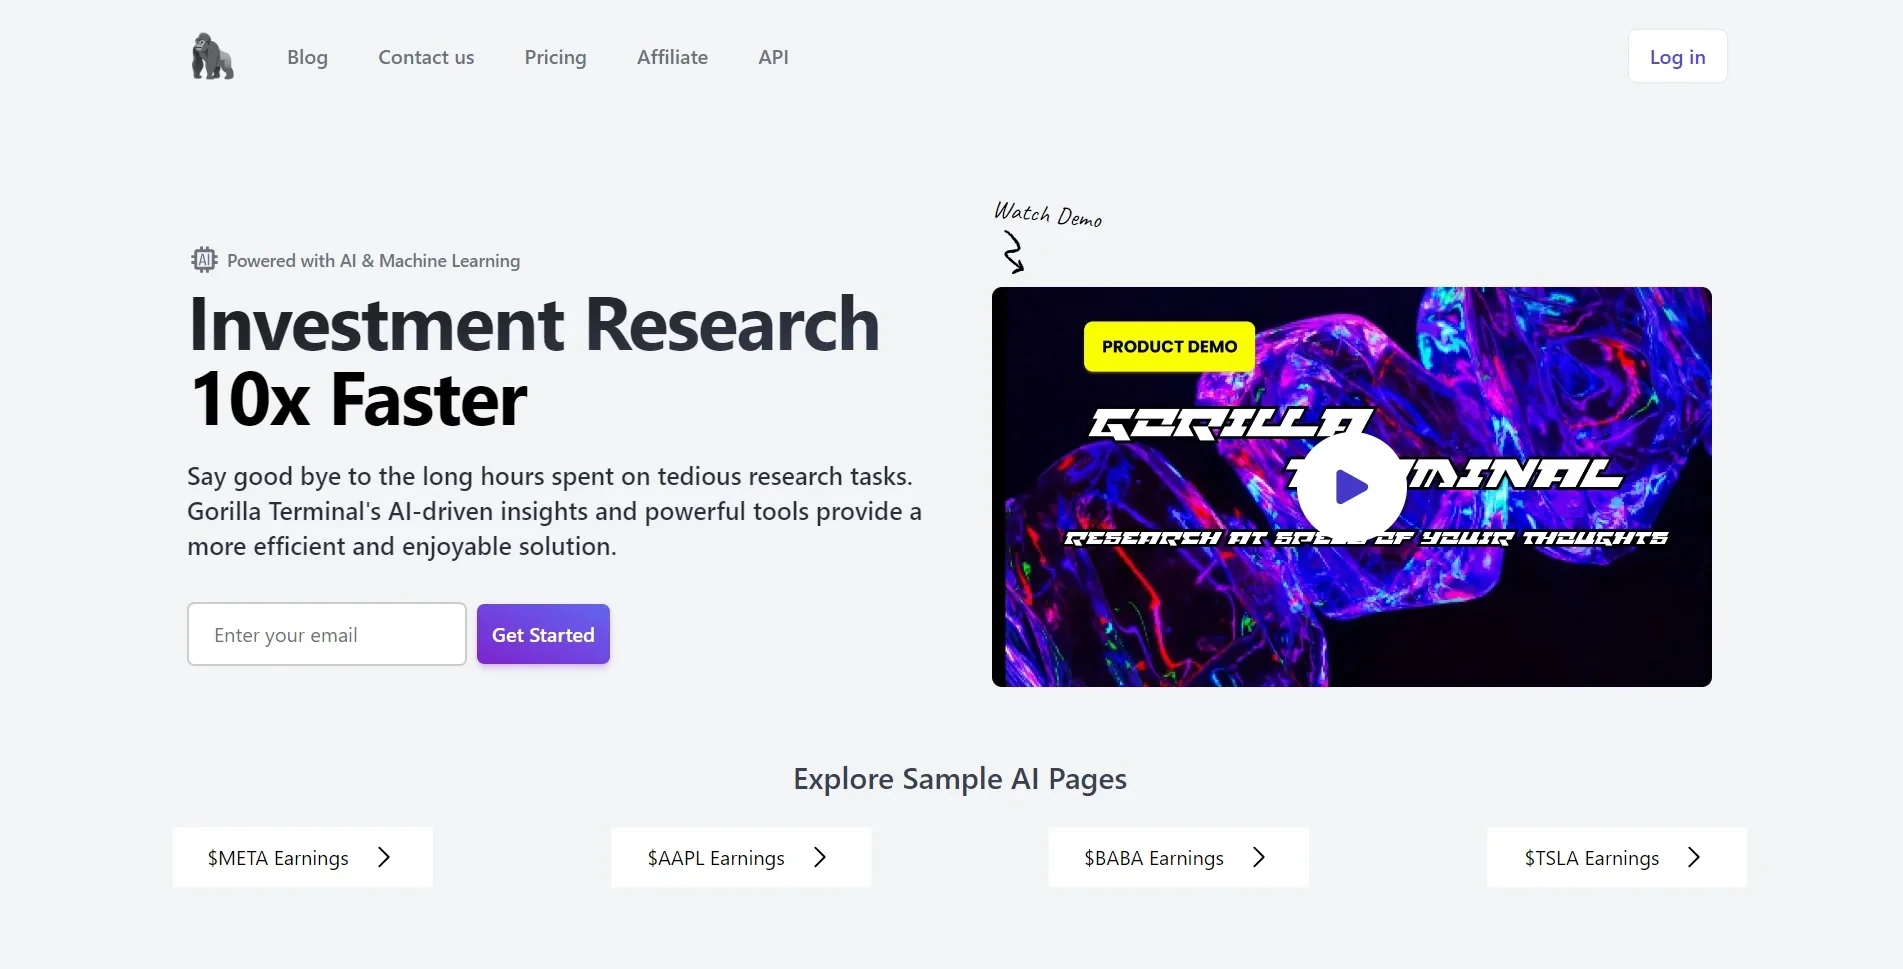
✏️ What does this tool offer?
Gorilla Terminal speeds up investment research by integrating lots of financial and economic data, and packaging it in an intuitive, dashboard/terminal-style interface. Features include macroeconomic indicators, earnings call analysis, supply chain analysis, sector overviews, risk metrics (like value at risk), regression models, financial statements, real-time news, and more.
⭐ What does the tool actually deliver based on user experience?
Users get quicker insights from earnings calls (with sentiment analysis etc.) instead of manually reading transcripts.
Access to a variety of data: macro data (CPI, unemployment, etc.), financial statements, supply chain info.
Tools for risk management: statistical / quant tools like value-at-risk.
A clean interface/dashboard which brings many data sources together so users don’t have to piece everything by themselves.
🤖 Does it include automation?
Yes — many parts are automated:
Automated sentiment analysis for earnings calls.
Automatic pulling/updating of macroeconomic data and financial statements.
Dashboards that auto-refresh, alerting risk metrics or new data.
💰 Pricing Model:
Subscription model (paid plans). Some references mention a free trial or “7-day pass” type of entry.
🆓 Free Plan Details:
There seems to be a trial or limited-time pass (e.g. a 7-day unlimited search pass) for low cost.
Limited/unrestricted features during trial; after that, need to upgrade.
💳 Paid Plan Details:
Full access to the dashboards, unlimited searches / data access, risk tools etc.
Pricing tiers mentioned (e.g. “Pro” plan, “Teams” plan) for different user levels.
🧭 Access Method:
Web-based platform (you access via browser)
Sign up required, with options to login via common methods (e.g. Google etc.) in some cases.
🔗 Experience Link:
https://gorillaterminal.com